Power BI data health
Data Health Signals
Power BI visuals that surface missing values, stale records, duplicates, and category drift before they reach decision-makers.
Purpose-built visuals that keep your data healthy, your pipelines honest, and your reports worth trusting.
Featured Custom Visual
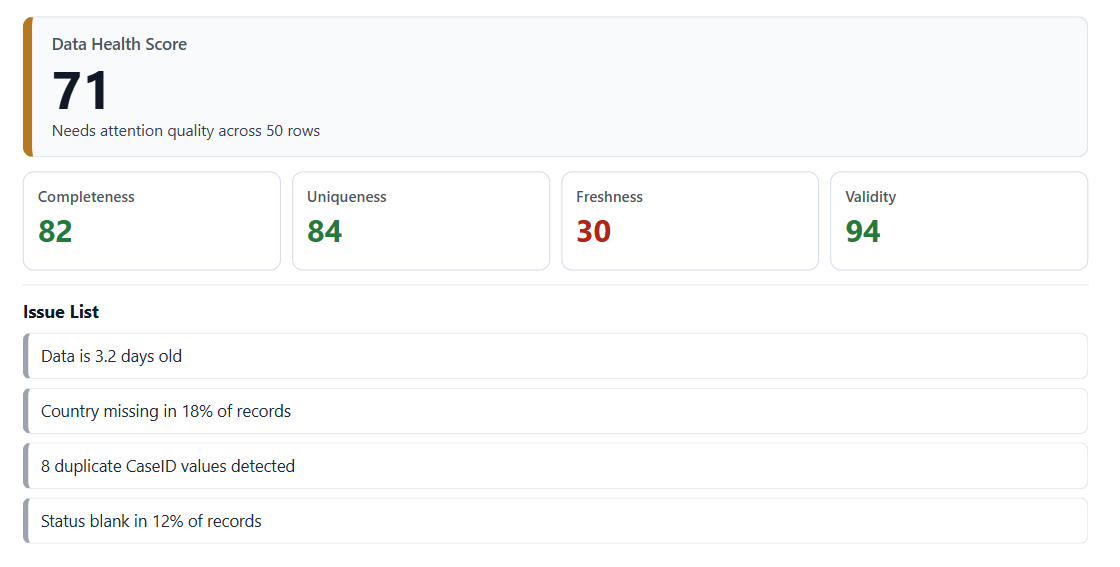
What we build
Power BI data health
Power BI visuals that surface missing values, stale records, duplicates, and category drift before they reach decision-makers.
Operational pipeline monitoring
Custom visuals that show failed runs, SLA misses, duration spikes, and pipeline status where report builders already work.
Power BI reporting trust
Focused visuals that help data engineers, BI developers, and analysts explain data health and system reliability inside Power BI.
Why it matters
The numbers shown to managers and analysts are only the final layer. Data engineers and analysts need fast ways to see missing values, duplicates, stale records, and category drift closer to the source of the report.
Custom visuals can turn Power BI into a practical monitoring surface for data pipelines, semantic models, and operational datasets, not just a presentation layer for finished KPIs.
When checks live inside the report canvas, data engineers, BI developers, and analysts can identify problems while looking at the same fields, filters, and business context used by the report.