Weighted Data Health Score
Computes a 0-100 score from completeness, freshness, uniqueness, and validity using intent-driven Power BI field buckets.
Gives report users a single trust signal before they interpret operational metrics.
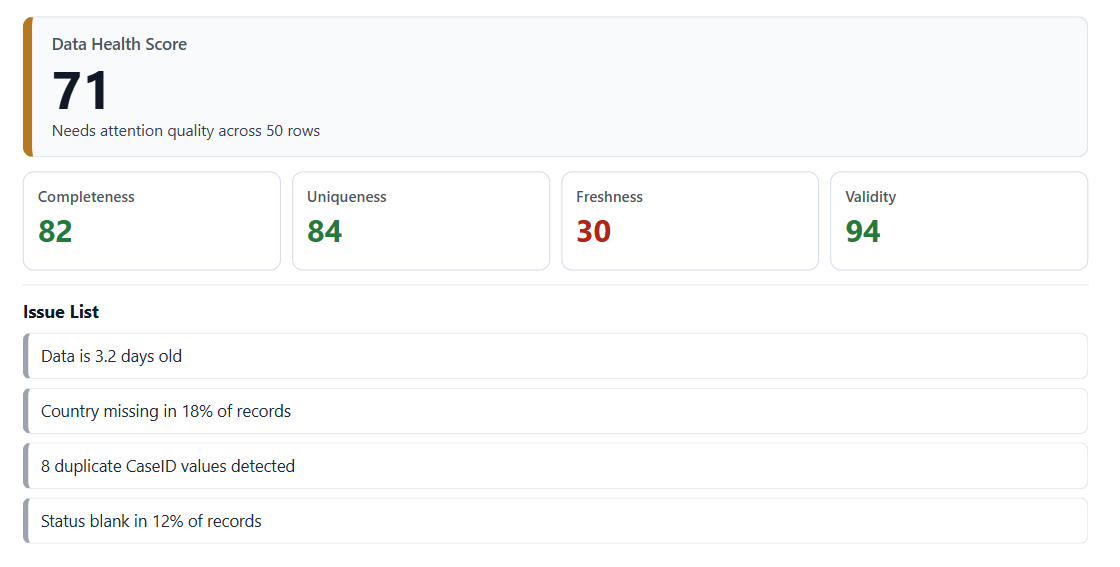
A Power BI custom visual that evaluates whether data can be trusted by showing a weighted 0-100 health score, four quality KPI tiles, and a plain-English diagnostic issue list.
What it does
Data Health Panel evaluates selected fields across completeness, freshness, uniqueness, and category validity. It gives teams a concise health score, focused quality indicators, and diagnostic issues without turning the report page into a troubleshooting maze.
Features
Computes a 0-100 score from completeness, freshness, uniqueness, and validity using intent-driven Power BI field buckets.
Gives report users a single trust signal before they interpret operational metrics.
Measures the average percent of non-blank values across fields selected for completeness.
Makes missing values visible inside the Power BI report instead of hiding quality checks in a separate workflow.
Compares the latest selected date against fresh and stale hour thresholds.
Helps IT and BI teams see when a Power BI report is relying on stale operational data.
Calculates distinct-value rates and flags duplicate identifier values, with row limits for distinct-count performance.
Reduces duplicate-driven reporting errors such as double counting cases, tickets, or transactions.
Checks category fields for blanks, low-frequency categories, and high fragmentation.
Surfaces operational taxonomy issues that can make filters, slicers, and status dashboards harder to trust.
Ranks diagnostic messages by severity and links issues to the related quality dimension.
Turns quality scoring into actionable report feedback for analysts, BI developers, and operations teams.
Field buckets
Score formula: 0.4 * Completeness + 0.25 * Freshness + 0.2 * Uniqueness + 0.15 * Validity
Fields where blanks or nulls reduce the completeness score.
Identifier fields where repeated values reduce the uniqueness score.
A date field used to evaluate how old the dataset is.
Category fields checked for blanks, low-frequency values, and fragmentation.
Controls
How to use
Use cases
Get the visual
Download the current Data Health Panel package for free. Documentation and Microsoft AppSource slots are prepared for the production release path.